The Power of Indicators Pt. 2
Apr 03
Article by Evan Hall
“If you don’t know where you’re going, you will not get there”
- Andy Grove
This is the second installment on my series about indicators. It’s going to cover how you can use leading indicators to show you what the future might look like in advance.
This will be short and sweet to introduce the concept, but will be a good primer for forecasting and using models posts on their way in the coming weeks. As such, I’m going to introduce the simplest form of leading indicator, the linearity indicator. As the name suggests the linearity indicator is a way for you to track your operations against a benchmark, in this case a straight line.
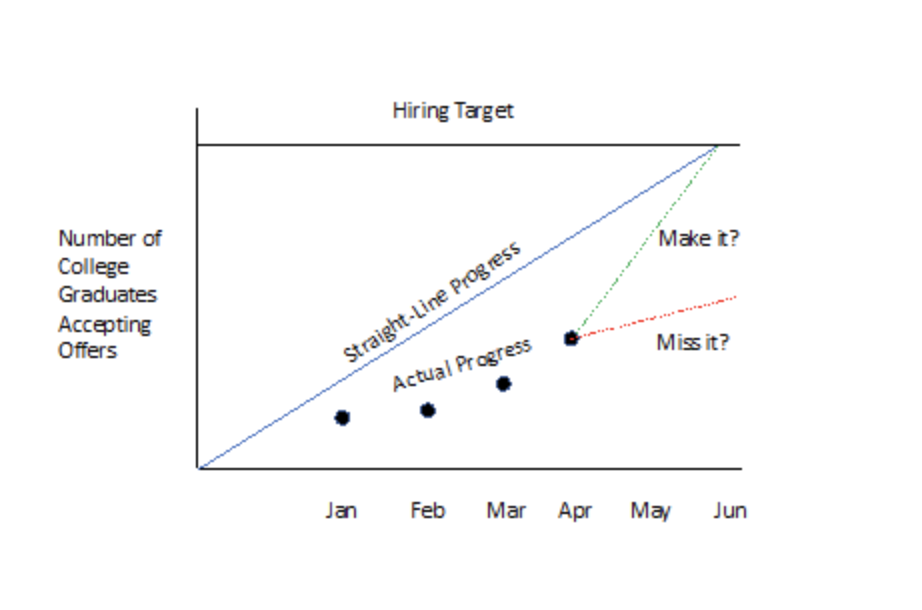
An excerpt from High Output Management p. 21 is the best way I’ve seen to illustrate the point. Here Andy Grove outlines their approach to their college recruitment process. I promise there’s a connection with aquaculture I’ll make shortly.
“Plotted here is the number of college graduates who have accepted our offers versus the month of the year. If all went ideally, we would move along the straight line that would yield our hiring target for the semester by the month of June. If by April the actual progress is as shown here, we find ourselves far below the ideal straight line. So from reading the indicator, we know that the only way to hit our target is by getting acceptance at a much higher rate in the remaining two months than we had gotten in the preceding four. Thus the linearity indicator flashes an early warning, allowing us time to take corrective action. Without it, we would discover that we had missed our target in June, when nothing can be done about it.”
Sound familiar? Maybe. Maybe not. But what if I edited the graph above to look like this:
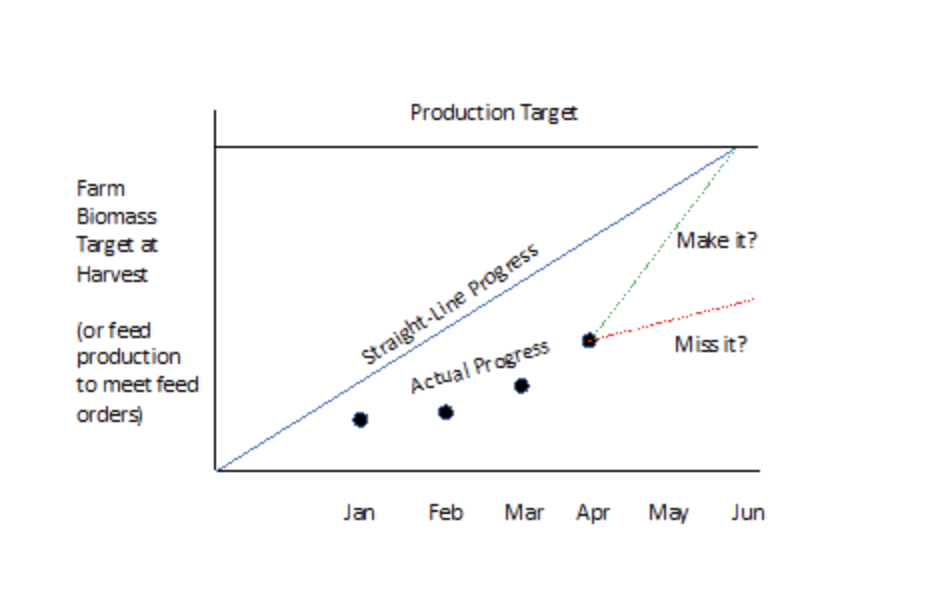
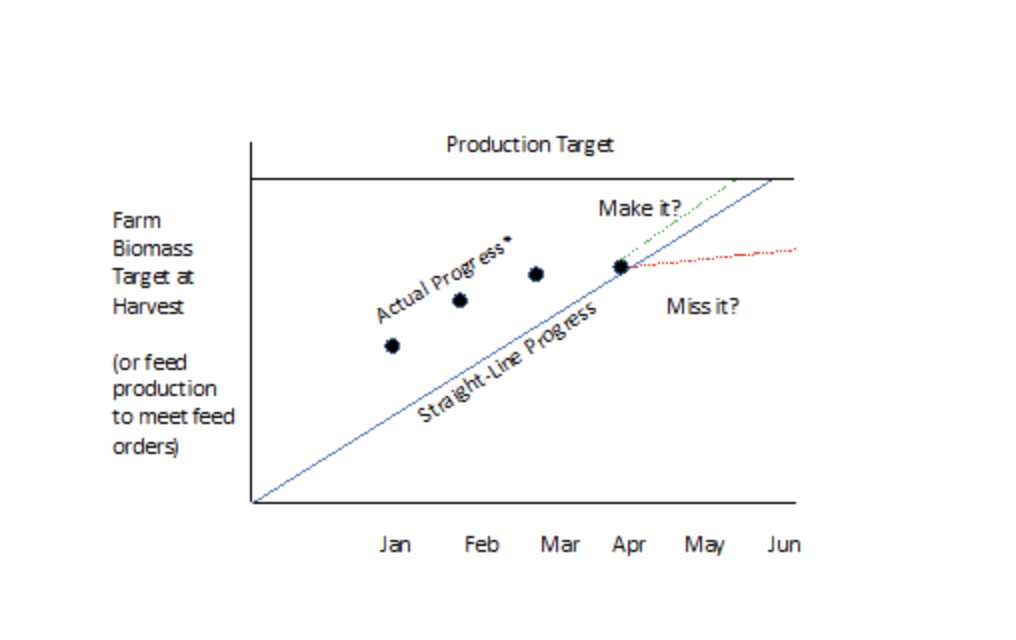
Or this:
*Actual progress is also notoriously difficult to determine in aquaculture for a variety of reasons (sample bias, difficulties sampling, variable size distributions etc.). For the purposes of this post we will assume these challenges of accuracy don’t exist. We will address these challenges and ways to mitigate sampling bias/error in future posts.
Do those look familiar? Probably. We see versions of those graphs regularly when looking at farm data. Worth noting is that biological systems rarely (if ever) follow a linear pattern, but the point here is that if you are not comparing your performance against some kind of benchmark or indicator, how do you know how well you are doing? And maybe more importantly, how will you know when you need to make changes in order to get back on the right path (and before it’s too late)? A linear indicator is the simplest and probably quickest way you can track your progress during grow-out and identify problems before harvest.
Was this useful? Any questions or challenges with the posts so far? As always your feedback will be really helpful in what sort of content we post here!
Talk to our Team